Funktionen
Zufällige Kurvenerzeugung
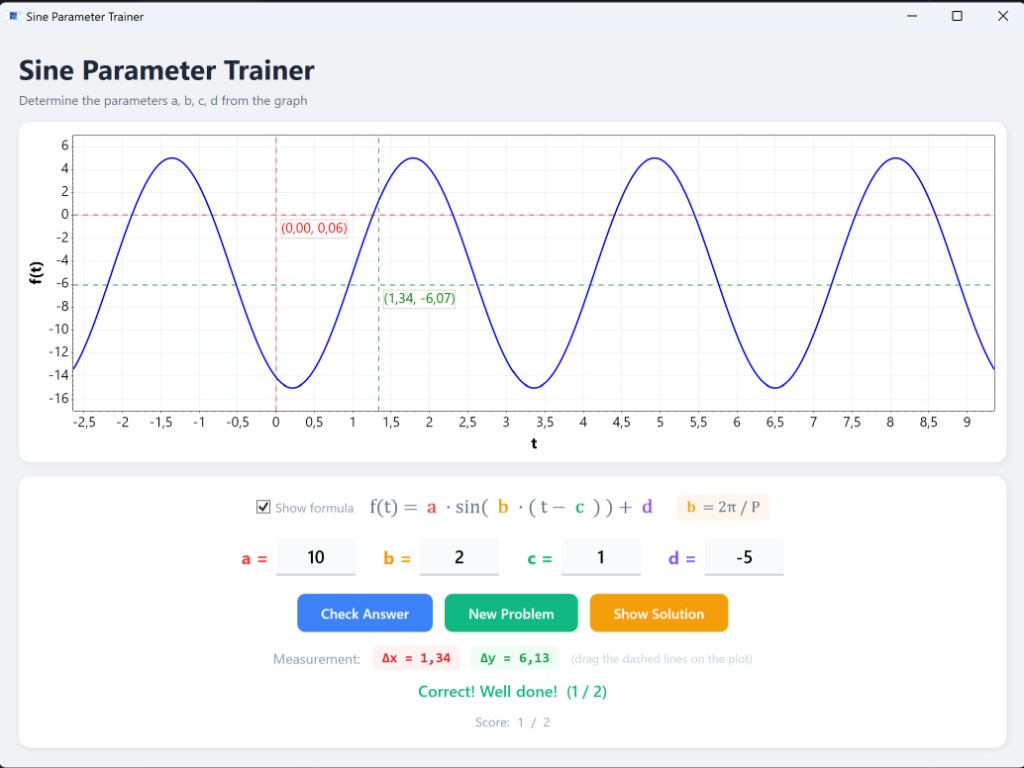
Jeder Klick auf Neue Aufgabe erzeugt eine neue Sinuskurve mit zufälligen Parametern.
Farbcodierte Formel
Die allgemeine Formel wird mit jedem Parameter in seiner eigenen Farbe angezeigt, passend zu den Eingabefeldern.
Ausblendbare Formel
Deaktiviere Formel anzeigen für eine zusätzliche Herausforderung.
Hilfsformel
Die Beziehung b = 2π / P wird als Erinnerung neben der Hauptformel angezeigt.
Verschiebbare Fadenkreuze
Zwei gestrichelte Linien (rot & grün) können auf dem Diagramm gezogen werden, um Abstände zu messen, mit Live-(x, y)-Beschriftungen.
Live Δx / Δy Anzeige
Abstände zwischen den beiden Fadenkreuzen werden in Echtzeit angezeigt — perfekt zum Messen von Periode oder Amplitude.
Intelligente Antwortprüfung
Akzeptiert äquivalente Darstellungen und sagt dir genau, welche Parameter falsch sind.
Brucheingabe
Antworten können als Dezimalzahlen (1.5) oder Brüche (3/2) eingegeben werden.
Punkteverfolgung
Zählt richtige Antworten gegen Gesamtversuche während der Sitzung.
Parameterbereiche
| Parameter | Rolle | Bereich | Typ |
|---|
| a | Amplitude | 1 bis 10 | Positive ganze Zahl |
| b | Frequenz (Periode P = 2π/b) | 0,25 bis 4 (Schritt 0,25) | Vielfaches von 0,25 |
| c | Phasenverschiebung | Abhängig von b (kleiner als halbe Periode) | Ganze Zahl |
| d | Vertikale Verschiebung | −5 bis 5 | Ganze Zahl |
Download & Installation
Die Anwendung ist eine eigenständige Windows-Datei — keine zusätzliche Software oder Laufzeitinstallation erforderlich.
- Lade die neueste Version herunter:
Download (Windows x64)
- Speichere SineParameterTrainer.exe an einem beliebigen Ort auf deinem Computer.
- Doppelklicke die Datei, um die Anwendung zu starten — das war's!
Hinweis: Der Download ist eine einzelne ~70 MB Datei. Alles ist enthalten — kein Entpacken oder Installieren nötig.
Oder überspringe den Download und probiere es direkt im Browser aus →
Anleitung
1. Den Graphen ablesen
Beim Start der Anwendung (oder nach Klick auf Neue Aufgabe) wird eine Sinuskurve gezeichnet. Bestimme die vier Parameter:
- a (Amplitude) — die Hälfte des Abstands zwischen Maximum und Minimum.
- b (Frequenz) — miss die Periode P mit den Fadenkreuzen, dann b = 2π / P.
- c (Phasenverschiebung) — der t-Wert, an dem die Kurve die Mittellinie nach oben durchkreuzt.
- d (vertikale Verschiebung) — die Mittellinie: (Max + Min) / 2.
2. Die Mess-Fadenkreuze verwenden
Ziehe die roten und grünen gestrichelten Linien direkt auf dem Diagramm:
- Platziere die beiden vertikalen Linien auf aufeinanderfolgenden Maxima, um die Periode (Δx) zu messen.
- Platziere die beiden horizontalen Linien auf einem Maximum und einem Minimum, um 2·a (Δy) zu messen.
- Jedes Fadenkreuz zeigt seine genauen (x, y)-Koordinaten an.
3. Antwort eingeben
Gib die Werte für a, b, c und d in die Eingabefelder ein. Akzeptierte Formate:
- Ganze Zahlen:
3
- Dezimalzahlen:
1.5
- Brüche:
3/2
Drücke Enter oder klicke auf Antwort prüfen zur Überprüfung.
4. Rückmeldung erhalten
- Richtig — grüne Bestätigung, Punktzahl steigt.
- Falsch — das Tool sagt dir, welche Parameter überprüft werden müssen.
- Klicke auf Lösung anzeigen, wenn du nicht weiterkommst.
5. Schwierigkeit erhöhen
Deaktiviere Formel anzeigen, um die Formel und den Hinweis b = 2π/P auszublenden und das Wissen aus dem Gedächtnis abzurufen.
Technologie
C# / .NET 10
WPF
ScottPlot 5
CommunityToolkit.Mvvm
Microsoft.Extensions.DependencyInjection
Projektstruktur
SineParameterTrainer/
├── Models/
│   └── SineParameters.cs            Parameter-Record
├── Services/
│   ├── ISineCurveService.cs          Service-Interface
│   └── SineCurveService.cs           Zufällige Parametererzeugung
├── ViewModels/
│   └── MainViewModel.cs              Anwendungslogik & Zustand
├── Converters/
│   └── StringToBrushConverter.cs     Hex-Farbe → WPF-Brush
├── MainWindow.xaml                   UI-Layout
├── MainWindow.xaml.cs                Plot-Rendering & Fadenkreuz-Steuerung
├── App.xaml / App.xaml.cs            DI-Container & Start
├── icon.png                          Anwendungssymbol
└── screenshot.png                    Screenshot für Dokumentation
Code-Signierung
Release-Builds werden ausschließlich von GitHub Actions aus dem Quellcode dieses Repositories erzeugt. Die Build-Pipeline ist vollständig automatisiert und reproduzierbar.
Teamrollen:
- Genehmiger & Committer: holgerschl (Repository-Eigentümer)
Datenschutz: Dieses Programm überträgt keine Informationen an andere vernetzte Systeme, es sei denn, der Benutzer oder die Person, die es installiert oder betreibt, fordert dies ausdrücklich an.
Lizenz: MIT-Lizenz — frei nutzbar, modifizierbar und verteilbar.
GitHub-Konto erstellen
Um unten einen Kommentar zu hinterlassen, benötigst du ein (kostenloses) GitHub-Konto. Falls du noch keins hast, dauert die Registrierung nur eine Minute:
- Gehe zur GitHub-Registrierungsseite:
Bei GitHub registrieren
- Gib deine E-Mail-Adresse ein, wähle ein Passwort und einen Benutzernamen.
- Löse das kurze Verifizierungsrätsel und bestätige deine E-Mail.
Das war's — du kannst dich jetzt anmelden, um Kommentare und Feedback zu hinterlassen.
Kommentare & Feedback
Hast du eine Frage, einen Vorschlag oder einen Fehler gefunden? Hinterlasse unten einen Kommentar — melde dich mit deinem GitHub-Konto an, um zu schreiben.
Features
Random Curve Generation
Each click of New Problem produces a fresh sine curve with randomised parameters.
Colour-coded Formula
The general formula is displayed with each parameter highlighted in its own colour, matching the input labels.
Hideable Formula
Uncheck Show formula for an extra challenge once the student is confident.
Helper Formula
The relationship b = 2π / P is shown alongside the main formula as a reminder.
Draggable Crosshairs
Two sets of dashed lines (red & green) can be dragged on the plot to measure distances, with live (x, y) labels.
Live Δx / Δy Readout
Distances between the two crosshairs are displayed in real time — perfect for measuring period or amplitude.
Smart Answer Checking
Accepts equivalent representations and tells you exactly which parameters are wrong.
Fraction Input
Answers can be entered as decimals (1.5) or fractions (3/2).
Score Tracking
Keeps a running score of correct answers vs. total attempts across the session.
Parameter Ranges
| Parameter | Role | Range | Type |
|---|
| a | Amplitude | 1 to 10 | Positive integer |
| b | Frequency (period P = 2π/b) | 0.25 to 4 (step 0.25) | Multiple of 0.25 |
| c | Phase shift | Depends on b (kept < half-period) | Integer |
| d | Vertical shift | −5 to 5 | Integer |
Download & Installation
The application is a self-contained Windows executable — no additional software or runtime installation is required.
- Download the latest release:
Download (Windows x64)
- Save SineParameterTrainer.exe to any location on your computer.
- Double-click the file to start the application — that's it!
Note: The download is a single ~70 MB file. Everything is bundled inside — no extraction or installation needed.
Or skip the download and try it directly in your browser →
How to Use
1. Read the Graph
When the application starts (or after clicking New Problem), a sine curve is plotted. Determine the four parameters:
- a (amplitude) — half the distance between the maximum and minimum values.
- b (frequency) — measure the period P with the crosshairs, then b = 2π / P.
- c (phase shift) — the t-value where the curve crosses its centre line going upward.
- d (vertical shift) — the centre line: (max + min) / 2.
2. Use the Measurement Crosshairs
Drag the red and green dashed lines directly on the plot:
- Place the two vertical lines on consecutive peaks to measure the period (Δx).
- Place the two horizontal lines on a peak and a trough to measure 2·a (Δy).
- Each crosshair displays its exact (x, y) coordinates in a label.
3. Enter Your Answer
Type values for a, b, c, and d into the input fields. Accepted formats:
- Integers:
3
- Decimals:
1.5
- Fractions:
3/2
Press Enter or click Check Answer to verify.
4. Get Feedback
- Correct — green confirmation, score increases.
- Incorrect — the tool tells you which parameters to re-check.
- Click Show Solution if you're stuck.
5. Increase Difficulty
Uncheck Show formula to hide the formula and the b = 2π/P hint, forcing recall from memory.
Tech Stack
C# / .NET 10
WPF
ScottPlot 5
CommunityToolkit.Mvvm
Microsoft.Extensions.DependencyInjection
Project Structure
SineParameterTrainer/
├── Models/
│   └── SineParameters.cs            Parameter record
├── Services/
│   ├── ISineCurveService.cs          Service interface
│   └── SineCurveService.cs           Random parameter generation
├── ViewModels/
│   └── MainViewModel.cs              Application logic & state
├── Converters/
│   └── StringToBrushConverter.cs     Hex colour → WPF Brush
├── MainWindow.xaml                   UI layout
├── MainWindow.xaml.cs                Plot rendering & crosshair dragging
├── App.xaml / App.xaml.cs            DI container & startup
├── icon.png                          Application icon
└── screenshot.png                    Screenshot for documentation
Code Signing Policy
Release builds are produced exclusively by GitHub Actions from the source code in this repository. The build pipeline is fully automated and reproducible.
Team roles:
- Approver & Committer: holgerschl (repository owner)
Privacy policy: This program will not transfer any information to other networked systems unless specifically requested by the user or the person installing or operating it.
License: MIT License — free to use, modify, and distribute.
Create a Free GitHub Account
To leave a comment below you need a (free) GitHub account. If you don't have one yet, it only takes a minute to sign up:
- Go to the GitHub registration page:
Sign up at GitHub
- Enter your email address, choose a password and a username.
- Complete the short verification puzzle and confirm your email.
That's it — you can now sign in to leave comments and feedback.
Comments & Feedback
Have a question, suggestion, or found a bug? Leave a comment below — sign in with your GitHub account to post.